
The mining industry has come a long way since the days of pickaxes and shovels. With the advent of steam-powered and electric machinery, mining operations became faster, safer, and more efficient. But it wasn't until the 21st century that mining technology truly entered the digital age.
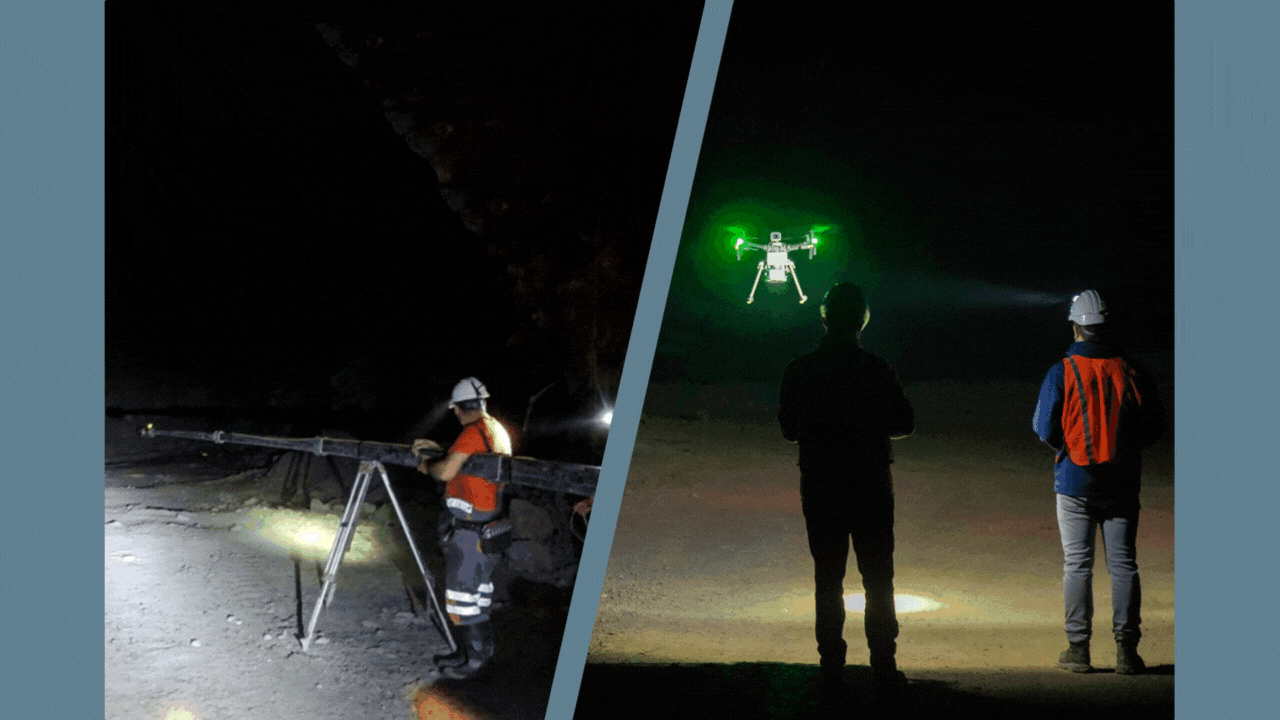
One of the fastest advancements we've seen in the industry is the adoption of LiDAR (Light Detection and Ranging) technology being used to accurately measure underground cavities. The mining industry started using laser scanners for underground mapping in the early 2000s and it quickly revolutionized the way mines were mapped, allowing for more accurate surveying that was previously impossible with traditional methods.
 We recently compared the use of a traditional CMS underground vs the autonomous ExynAero
LiDAR is incredibly important for mapping 3D cavities underground because, as you can imagine, there isn't a lot of light in a mine! Therefore other 3D mapping methods, such as photogrammetry, won't work underground. However, while it's easy to walk down a drift with a laser scanner, it's much harder to fit that into a massive open stope. To map these incredibly large and unknown environments we need a very special algorithm that can map and move in real time – simultaneous localization and mapping (SLAM). You know it, it's SLAM man!
LiDAR-based SLAM is a technology that combines two important capabilities: mapping an unknown environment and navigating within that environment in real-time. It involves the use of a LiDAR sensor, which emits laser pulses to detect and measure the distance to surrounding objects.
Our current mining customers are able to capture point clouds with millions of points, which is a significantly dense point cloud that introduces processing issues for mining software use to track volumetric analysis (Deswick, etc). They then have to shrink the size of the point cloud quite significantly to load it into their measurement software for evaluation. This is done through a downsampling algorithm which removes points while retaining the shape and structure with less detail. They will then use this information to calculate the size of the cavity, under-break, over-break, and a variety of other volumetric analyses.
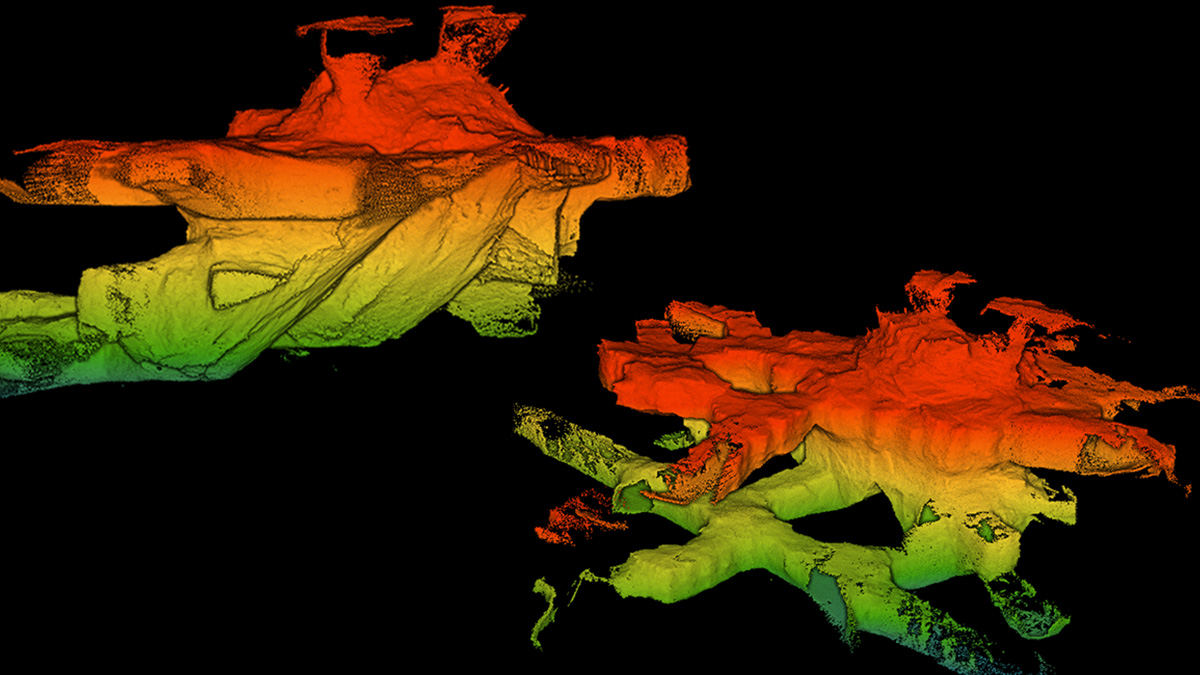
Example point cloud of an underground cavity
The mapping data captured by LiDAR-based SLAM technology is necessarily dense to provide the highest level of detail where needed - but not all teams within mining operations need that level of detail. To meet the needs of various teams, there are several potential operations that many of our customers perform after capturing and post-processing a point cloud.
However, geologists and others on the mining team are interested in point cloud data as well, but after it's downsampled it's too decimated for them to use. This is where today’s digital mine can leverage cloud-based capabilities that allow everyone to quickly convert massive 3D datasets into actionable insights while improving collaboration between teams.
 Click here to view Exyn Nexys point clouds in a web-based viewer
Benefits of the Web-based Point Cloud Visualization
Web-based point cloud visualization software, like Stitch3D, is designed to streamline, visualize, and manage point clouds and reality capture information used in mining and construction projects, helping teams improve communication workflows and maintain a digital record of assets, construction progress, excavation, or actual changes in different environments.
A key benefit is the capability to reduce expensive and time-consuming on-site visits. It optimizes time and resources while keeping field personnel in the field and office personnel at their workstations with real-time collaboration in the cloud.
SLAM data is efficient because of its high level of accuracy and precision, quickly capturing datasets of large areas in a few minutes instead of hours. Still, datasets can be very large, in the order of Gigabytes or even Terabytes, so it gets difficult to store and organize. The typical process is once the data is captured, it is usually stored in hard drives or servers on-site, then processed. Then only some of the information is sent to offices for further analysis, blocking users from fully using point clouds and their potential. With a web-based point cloud viewer, simply upload whole datasets, store them into different projects and have them all organized in dashboards that are easy to navigate and share. All the information is available for stakeholders to review, interrogate, and even download locally to perform more extensive analysis out-of-site, which is more cost-efficient.
Now that you have your 3D data stored and organized, different teams in different departments can view it almost instantly. The data gathered and uploaded on the field is now available for various teams to start working on it simultaneously. E.g. blast engineers can work on the optimized location of explosives, drilling engineers on mapping routes, inspectors can see the site and asses any potential hazard and validate adherence to protocols, and pump stations can be modeled and virtually located in the space to check fit and design the pipe-routing, validating tolerances and the avoidance of any collision in the virtual environment.
What happens when all teams have access to the information? They all can collaborate from a centralized source of information and share findings with specific locations and viewpoints, while working on the same notes and documents to boost production. They can create scenes and virtual tours so everybody understands the environment and all can have the physical context to optimize their workflows, increasing safety while reducing man hours on site.
A digital twin of the mine is based on point clouds where valuable data gathered by the surveying team is democratized and generates value across different teams within engineering departments and operators by allowing them to quickly, easily, and intuitively share, visualize, manage, analyze, and generate insights from your 3D datasets.
